Structured Literacy Goal Bank & Data Tracking System
Hi friend,
If you are anything like us, the idea of research-based instruction and data-driven practices gets you super excited…but if it makes you nervous or feels overwhelming - that’s okay, too!
In literacy intervention, we know that targeting our instruction to fit our students’ needs is the FASTEST and MOST EFFECTIVE way to get them results. However, we often hear that tracking data takes up too much time, is too confusing, or is just plain overwhelming.
We get it - there are a LOT of things on our plates as interventionists. That’s why we wanted to make data tracking simple. With this framework, we have been able to make writing goals, taking data, and targeting our intervention to hit those goals so much easier and we can’t wait to share it with you.
Setting Yourself and Your Students Up for Success
We know that the ONLY way to ensure that students are on the right track and effectively closing the gap is to set effective goals and track data to measure students’ progress. Tracking data and showing growth can be EASY if you have the right system (and effective goals!) in place.
Where do I start?
When we begin working with new students, we always want to start by creating solid goals for them so we know what we are working towards. We will begin with an assessment to get a look at the student’s literacy abilities as they relate to phonological awareness, phonics, vocabulary, fluency, comprehension, and writing. Then, we will create a treatment plan using SMART Goals, meaning they are specific, measurable, achievable, realistic, and time-based.
A common misconception here is that we can’t use the same goal for two different children. The reality is that we CAN use templated goals that are individualized based on the student's data.
For example - we can use an outlined goal like, “Student Name will improve his/her phonological awareness skills (including blending, segmenting, and isolating words, syllables, and sounds) in order to support foundational reading and spelling ability from a baseline of XX% to 90% accuracy or greater by his/her annual review as measured by a structured curriculum-based assessment.” This outline follows the SMART Goal format but leaves room to individualize it based on your specific students.
You can grab our templates in the 5CCL Activity Library!
We suggest using these templates to help establish IEP goals, intervention treatment plans, Response to Intervention goals, READ Plan goals, or whatever else you may need to provide data-driven observations of student growth.
Once you have goals in place, tracking data & targeting your intervention as necessary will be the most effective way for you to help students reach those goals.
As a part of our data-tracking system, we have included our data-tracking spreadsheet that you can use to aggregate the data from your daily/weekly lessons!
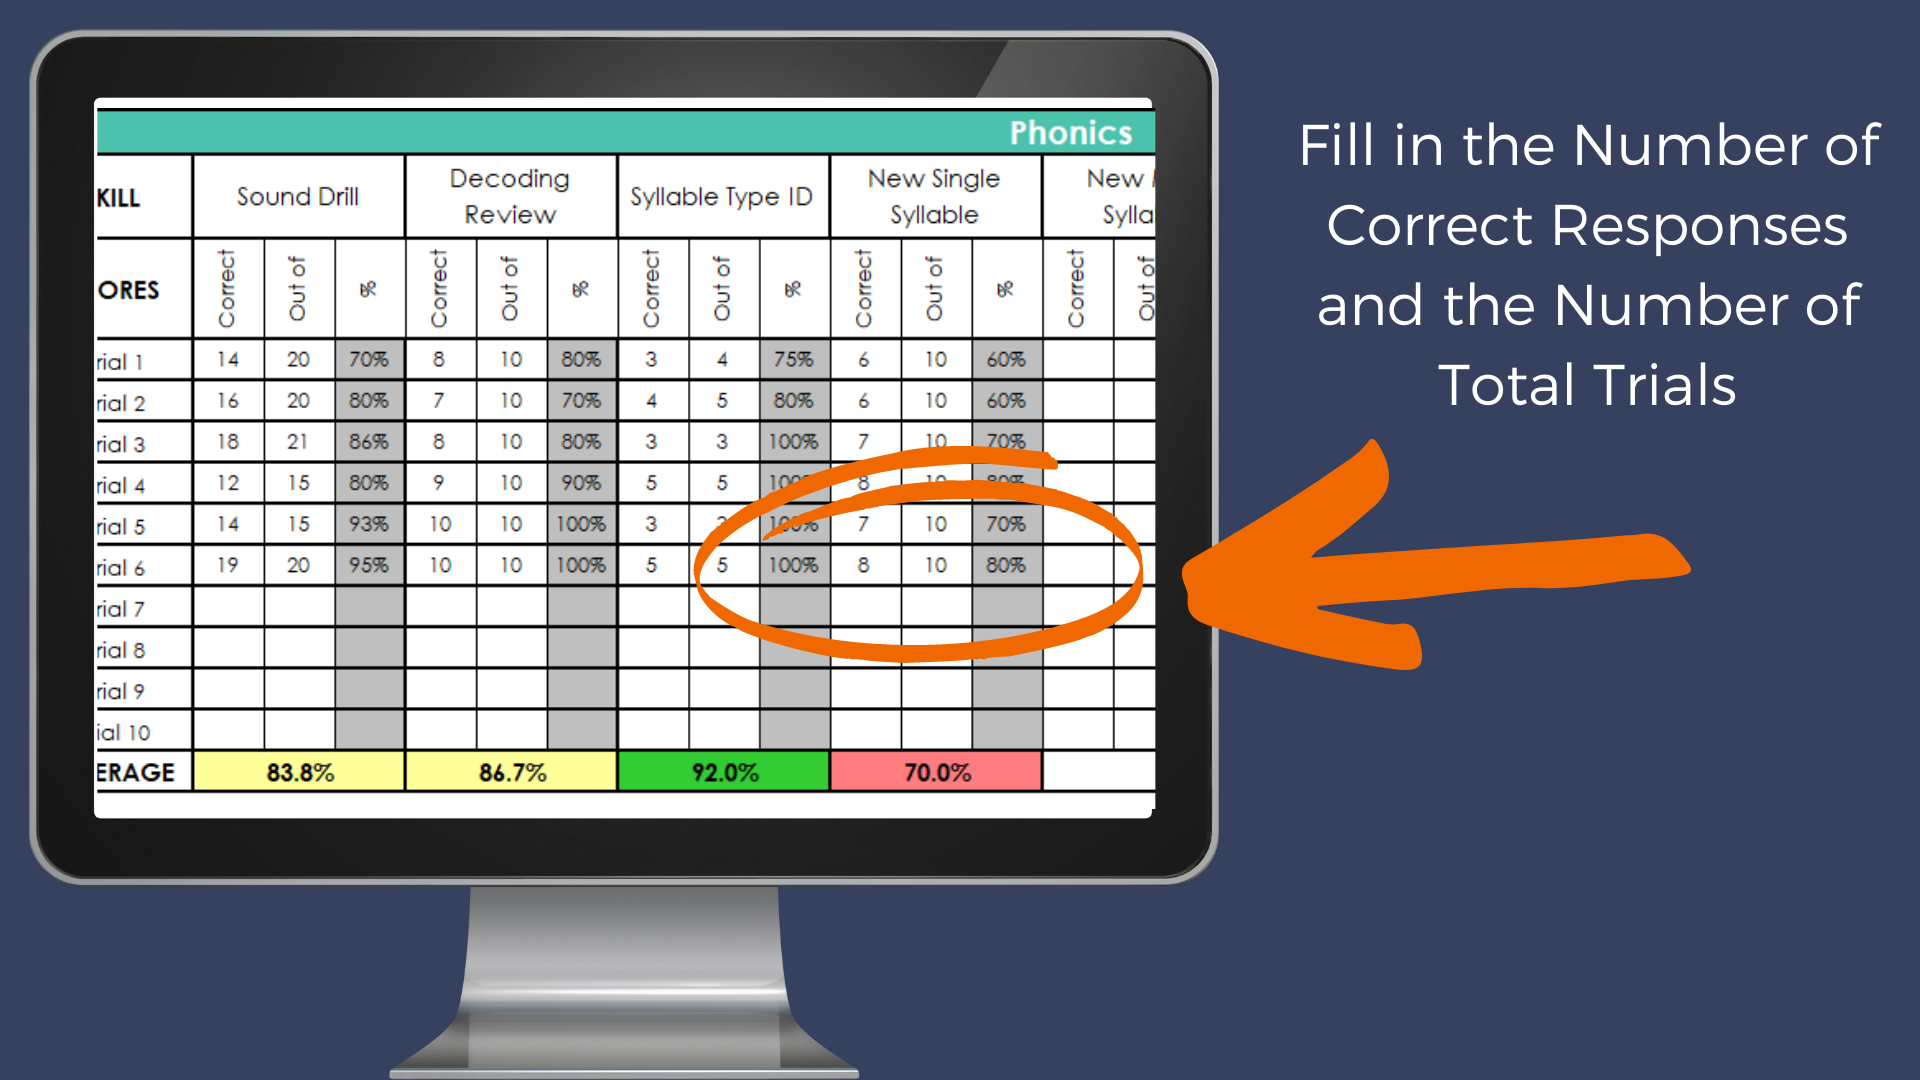
This system was designed to make taking & analyzing data easy so that it won’t take time away from your intervention. The spreadsheet is set up so that you just have to put in the number of correct responses & total trials for different activities in your lessons. Then - it analyzes the data and color codes it based on students’ proficiency levels!
It sounds complicated but it’s actually super simple - check it out.
Step 1: Complete activities that align with the student’s literacy goals.
You are already completing intervention activities - all you need to do now is keep track of how many trials the student was given & how many correct responses they had!
Step 2: Put the data into the spreadsheet
During or following your session, add the number of correct responses and total trials into the spreadsheet. It has multiple tabs so that you can keep data for all of your students in one place.
Step 3: Use the color-coded averages to help see where students are proficient, almost proficient, and struggling.
This makes targeting your intervention easier because you can quickly see where students need the most support. If the average is green, it means that students are averaging over 90% accuracy. Yellow averages indicate between 80-89% accuracy, and red would be below 79% accuracy. Areas that are red need the most support!
This also allows you to monitor if students are on track to meet their goals. You have the information you need to know how they are performing so that when it comes time to reassess the student there are no surprises!
With this system, you can say goodbye to…
any uncertainty regarding your students’ performance. You will always have a clear, color-coded picture right at your fingertips.
the dread of writing new goals for every new child because you will have a template of effective, data-driven goals ready.
the clutter of a million Post-it notes with random data points scribbled on them because you have a comprehensive, organized spreadsheet to keep everything in.
Truly effective, data-driven instruction has never been easier, and to help, we have provided access to our Data Tracking System. Be sure to grab thefree Data Tracking System. This tool will help make data tracking easy and help you keep your session data organized.


